Custom dashboards
built for your operations.
WOVECX project dashboards give stakeholders a single view of areas, crew status, timelines, field reports, and clock logs. Built for complex, multi-phase facility projects.
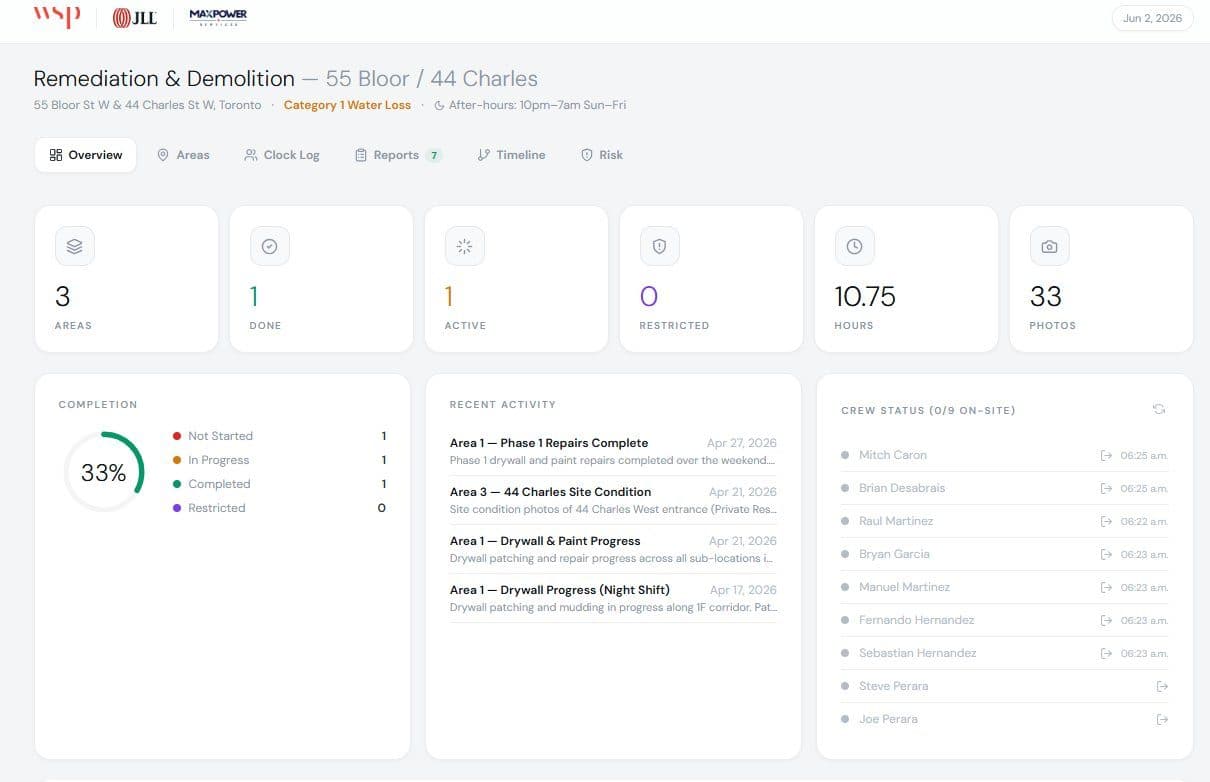
Live project dashboard, Toronto - built in partnership with enterprise clients
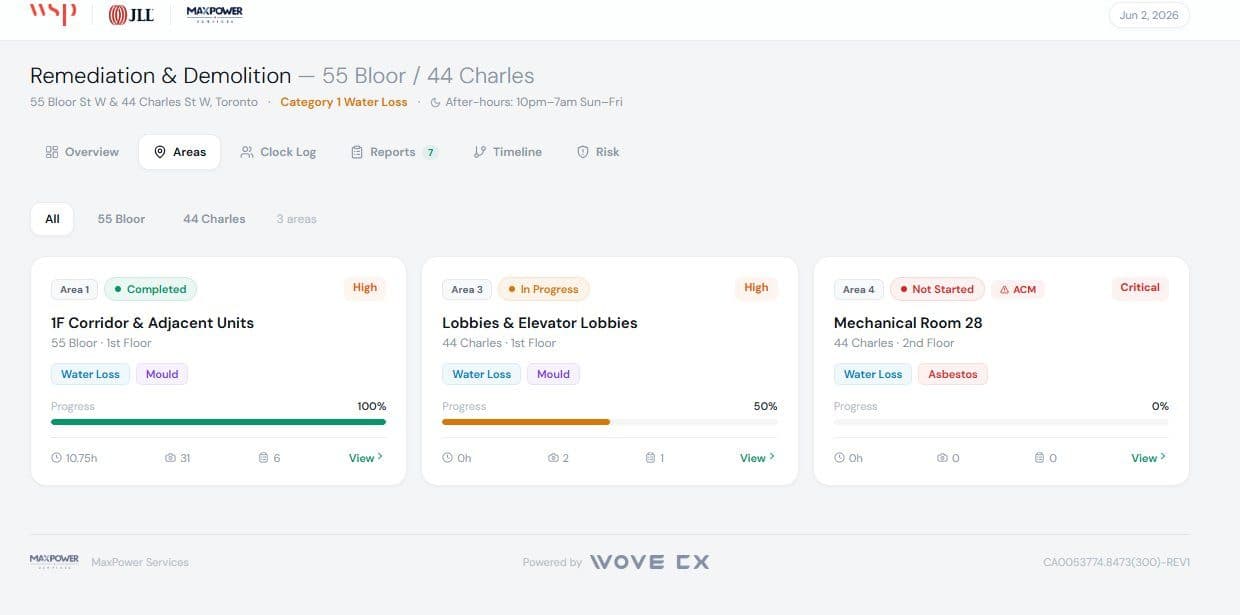
Track every scope area with real-time progress.
Each project area gets its own card with status, risk level, progress bars, hours logged, and photo counts. Filter by location and see exactly what's done, in progress, or not started.
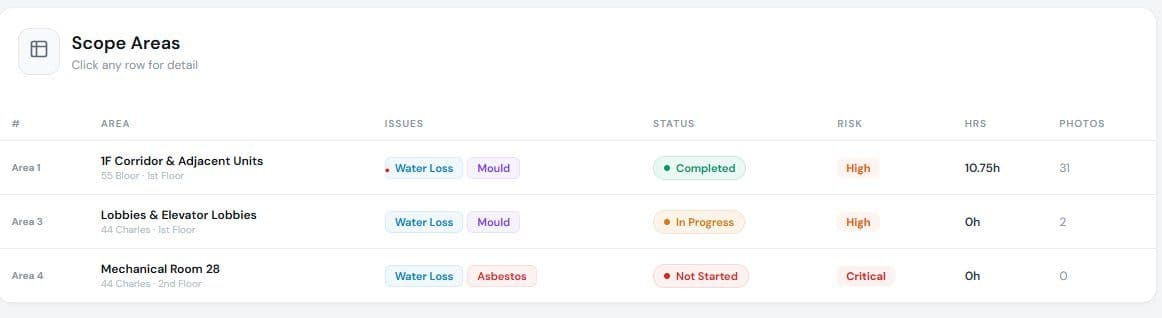
Structured scope views for complex projects.
Break down projects by area with issue tagging, status tracking, risk levels, and logged hours. Click any row to drill into the detail. Built for remediation, renovation, and multi-phase facility work.
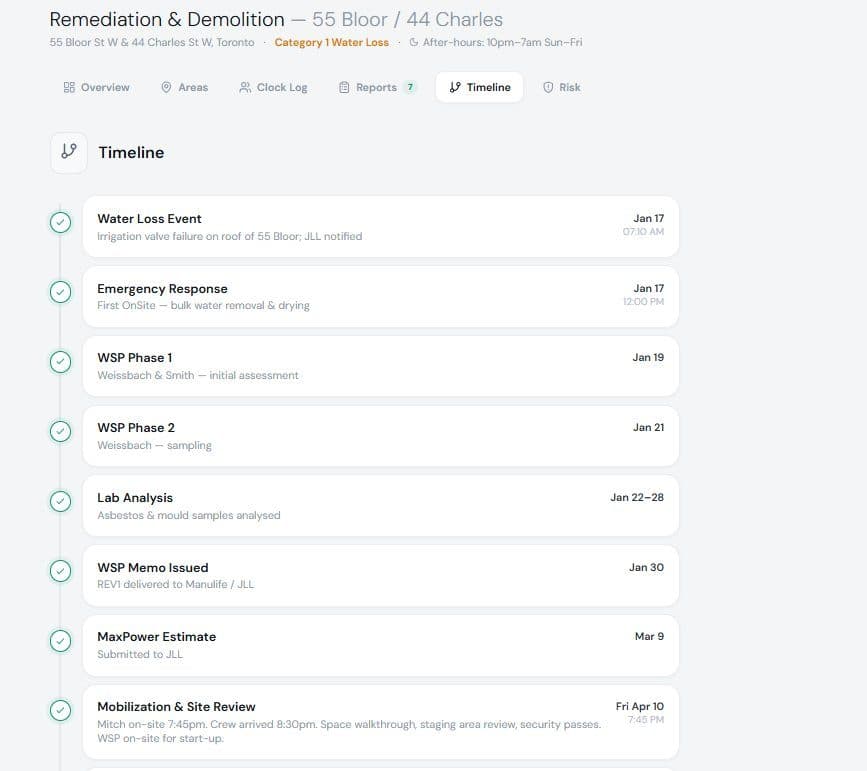
Keep every project on schedule.
Map the full project lifecycle from initial event through completion. Each milestone is logged with dates, descriptions, and responsible parties. Everyone sees the same timeline.
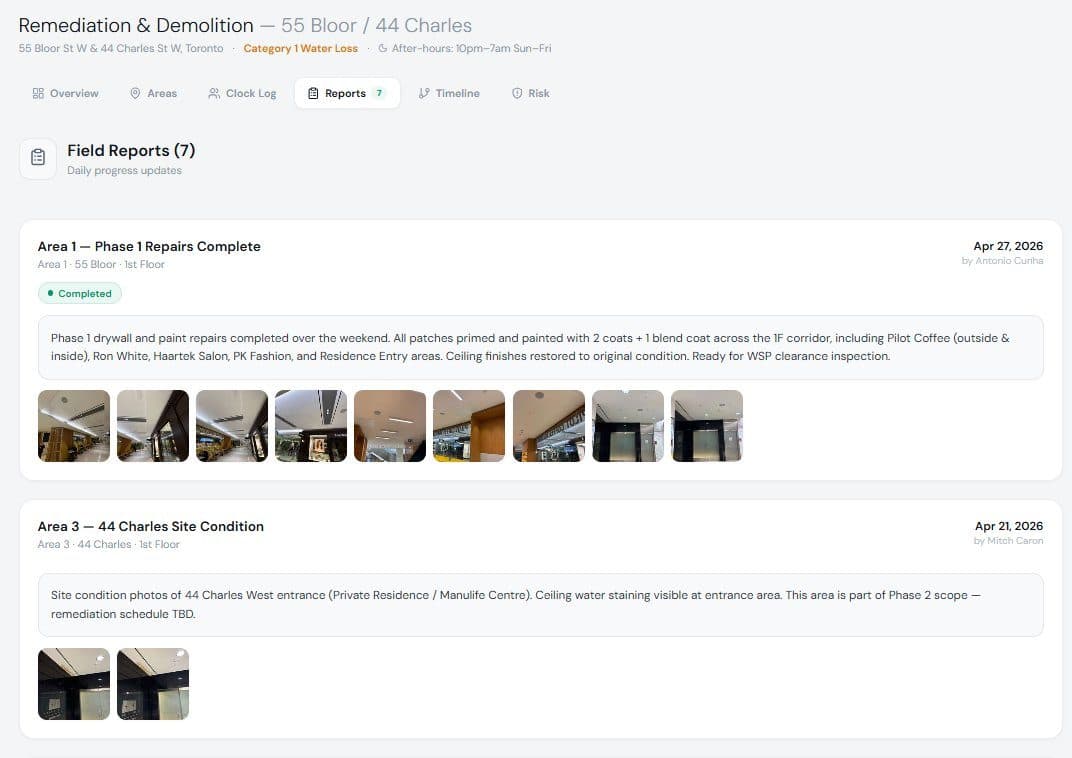
Field reports with photos and descriptions.
Each report captures detailed field observations with status, descriptions, and photo documentation. Reports are tied to specific scope areas and authored by team members on-site.
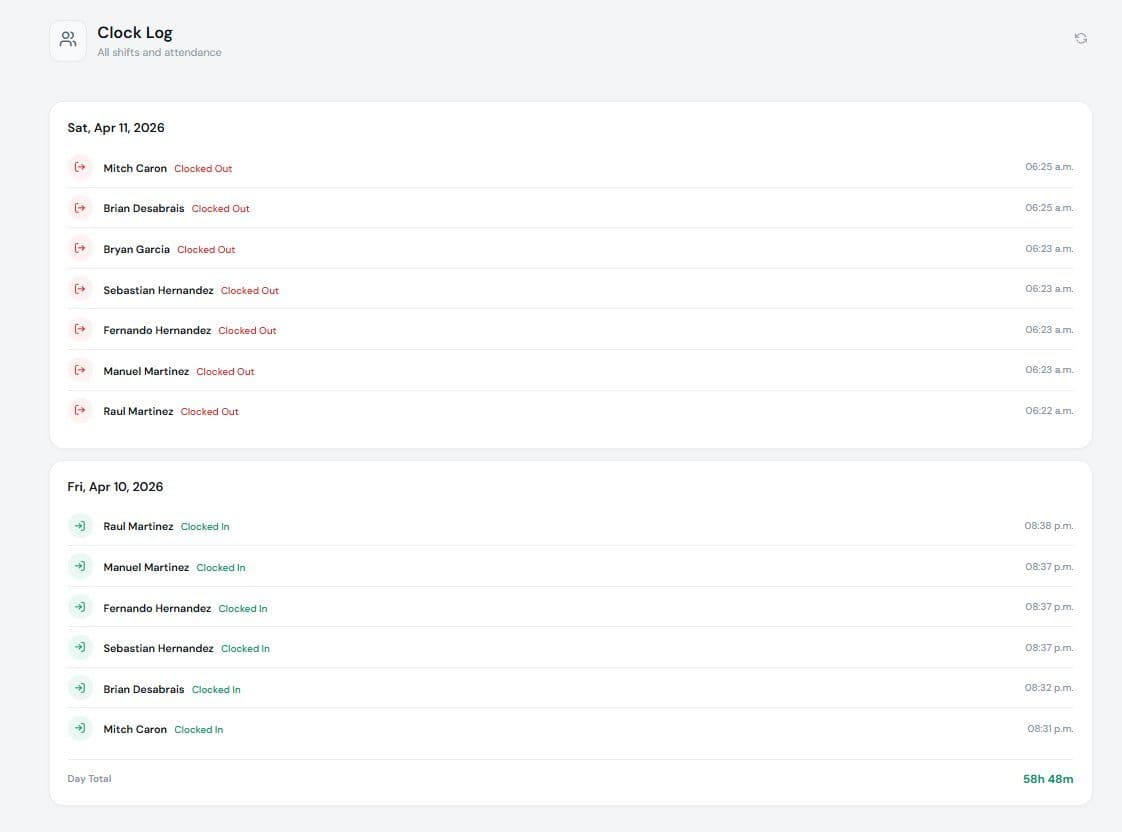
Every clock in, every clock out, fully logged.
Complete transparency into crew attendance. Every shift is recorded with exact timestamps, grouped by day. Managers and stakeholders can verify who was on-site and for how long.
Want a custom dashboard for your portfolio?
We'll build one tailored to your sites, teams, and reporting needs.